Telluric Current Experiments...
Information about experiments associated with Telluric Currents.
Telluric DVM Data
The data collection software saves the voltage readings in text format in files of 500 samples length. I further process this data with my own software to concatenate individual files into one single file and then convert to binary (4 -byte floating point) values and save to disk. My software can also save the data as a WAV file. My software can display each 500 sample block in the whole record and apply some simple filtering and scaling functions.
Below is a screen shot of one of the blocks:-
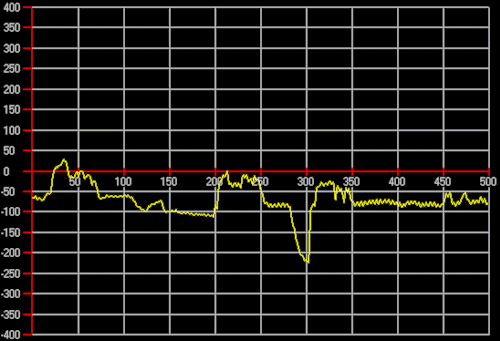
The width of the graph is 500 samples at 1 sample per second - i.e. the above graph is 8.33' minutes wide.
The PC I used for these preliminary experiments was a small laptop whose hard drive has gone west and so I can only store about 50 hours of data on the external floppy-drive disk drive. I will have a set up for recording almost unlimited data at 1 sample per second in the future.
Examination of a typical data block of 500 samples shows a sinusoidal signal of small amplitude with a period of about 4.5 seconds and a number of step changes.
In addition to the small 4.5 second sinusoidal signal there are the step changes in potential of approximately 50 seconds duration.
Out of curiosity I decided to use a well-used method for presenting very slow data in a manner which is easier to analyse. This method converts the data to a WAV file to allow a speeded version of the data to be played back as audio.
Telluric 'Sounds'
Because of the extremely slow variation in data which is collected at 1 sample per second, I used a well-known technique for presenting the data in a more digestible form. The original 1 sample per second data is converted into a WAV file for play back. The effective sample rate is 4000Hz, therefore the data is speeded up by a factor of 4000.
To allow you to listen to the results of this exercise here is a WAV file (218Kbytes).This file compresses the data from just over 30 hours into a playing time of about 30 seconds.
For those who have Real Player here is the same set of "sounds" in a real audio format (60Kbytes).
Note the rhythmic nature of the data. It reminds me of the beating of the shields in the movie "Zulu".
The whistle you can hear is the 4.5 second period sinusoidal signal speeded up to about 900Hz.
The rhythmic beat is a mystery. Below shows a short segment of the data which produces this effect:-
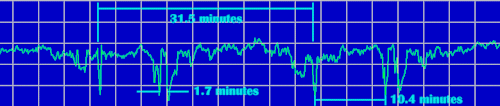
Note the similarity of the consecutive waveshapes and the long period (remember the data is speeded up by a factor of 4000).
What produces this I don't know. The regular nature of the data indicates a man-made source, but what ? The 4.5 second signal may be related to microseisms - or not.
Here are two more runs in WAV file format:-
tell_2.wav and tell_3.wav
and in real audio format:-
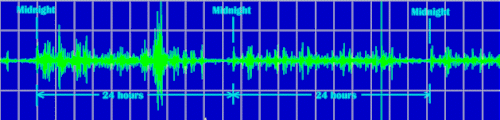
Update 7 Dec'00: I have taken a record of signals over about 2.5 days and there is a definite 24 hour repeating pattern (see below). The starting time is very close to midnight local time (when correcting for DST) and the pattern repeats with a macro-structure of 24 hours. Obviously man-made but I still don't know what it would be. The definite repeating macro-pattern has me mystified.
Telluric 'Sounds' Comments
I have received a large number of responses as a result of the Telluric "Sounds" files. Instead of attempting to reply individually I thought it would be better to summarise the responses here for all to see. In order of most frequent:-
4.5 Second Period Sinusoidal Signal
Many of you suggested that it sounded like the unstable birdies from the power mains. This was my impression too. A quick calculation had shown that the necessary error for a beat with the sampling frequency was much larger than the observed drift from many measurements. Another suggestion was an error in the sampling itself (Stewart). I had also thought of this but had dismissed it as I had calculated that the PC clock would have to be out by over 8 minutes in 30 hours to cause this effect - this is clearly not the case. Nevertheless, I agree that this is the most likely cause. In particular I suspect that the 1 second sampling rate from the provided Protek software is missing samples as 1 sample a second is close to the conversion time for the DVM. Missing one sample in 200 to 300 samples would do the trick.
Rhythmic "Zulu" Beat
Most responses were in line with what I suspect - the pattern is too regular to be anything other than man-made. The problem is what is it ? My first idea was that it was our 'fridge. Unfortunately there was no correlation between the signal and the fridge switching off and on. Also we live in the "sticks" or bush (farmland in non-Aussie lingo). The other problem is that the pulses are not narrow in time. See below and you will observe that the third pulse in the train (the one which is to the right of the 1.7 minute marker) has a decay time of over two minutes. This is difficult to explain away as a switching transient. The only thing I can think of is that this is the result of sudden increases in mains earth current which depolarises the contact potential associated with the earth rods. This could be checked by monitoring the mains current noise level simultaneously.
Nevertheless, the regular nature of the pulses almost certainly point to a man-made source - I will continue to try and isolate the cause. If others can carry out the same experiment at another location this would serve to throw some light on the puzzle.
WAV File Format
There were several queries about the actual WAV ( and Real Audio) files presented. Several people who have analysed the files have correctly identified the processing I have done. The original text file (floating point text readings from the DVM) was normalised to +-1.00 and then converted into a WAV file at a sample rate of 8000Hz. The sample rate was chosen because the WAV to Real Audio conversion application I use will only accept "standard" sample rates (8000Hz being the lowest it will handle). The problem is that that the resultant audio output from this sample rate is too fast to hear the rhythmic pulses. Therefore before conversion to a Real Audio file I use transpose processing to halve the frequencies to a slower rate (equivalent to a "playback" rate of 4000Hz). As you would know this will produce image products which I filter out by low-pass filtering with a cut-off frequency of 2000Hz. Saving as an 8-bit file re-introduces some quantisation noise above the cutoff frequency. This slowed down WAV at a sampling rate of 8000Hz is converted to Real Audio files with substantial savings in space.